Insights into global media and device usage in 44 markets, and how consumer habits shifted towards mobile after the 2020 pandemic lockdown.
 United States (US)
 The US coverage in the Global Media Intelligence Report includes poll results of the following metrics. Click the links to see each country’s or territory’s charts for the following metrics:
- Device Ownership
- Smartphone and Tablet Owners
- Smart TV Owners
- Average Time Spent With Media
- Traditional Media Users
- TV Viewers
- Video-on-Demand (VOD) Viewers
- Social Media/Messaging Users
- Digital Audio Listeners
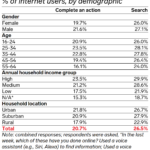
- Voice Assistant/Search Users
 Key Takeaways
- TV viewership in the US is higher than in any other country tracked by GWI, in terms of time spent viewing TV. The US appetite for linear TV is fueled by a wide array of programming choices, including a surplus of services delivered via digital channels across devices.
- Mobile media consumption continues to displace viewership and listenership in traditional channels. In addition to getting their entertainment on smartphones, consumers are spending more time using mobile apps, especially for social networking and messaging.
- Audio listenership is up across the country, led by growth in music streaming, audiobooks, and podcasts. Audio listening hours are on the rise, including for radio, which remains stable.
- Smart device adoption is accelerating as internet-connected peripherals become the norm. Smartphones are ubiquitous, smart TVs are more common than standalone TVs, and smart wearables like watches and wristbands have become mainstream.
The US in Perspective
TV consumption is significantly higher in the US than in any other country tracked by GWI.
- The US is the No. 1 market worldwide for TV viewing—by a wide margin. Average daily time spent with the medium in H1 2022 was 2 hours and 56 minutes (2:56), 16 minutes more than any other country tracked (UK and Romania tied for second place, at 2:40 daily.)
- High TV consumption in the US is tied to almost unlimited choices for content, including a traditionally competitive network TV model, myriad cable services, and a wide array of live sports on TV, both amateur and professional.
- The strong appetite for long-form entertainment isn’t limited to analog delivery. In H1 2022, average time spent consuming online TV/streaming was 1:53 for the US, which tied for fourth out of the countries tracked. Since 2019, time spent with online TV/streaming is up 37.8%.
US consumers watch a blend of linear TV and online streaming services content via the largest screen in the home.
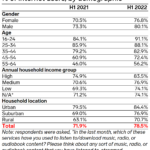
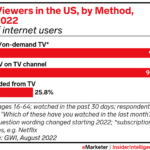
- The vast majority (99.0%) of respondents watched TV in any form in H1 2022. The leading source for TV content was an on-demand/streaming service, cited by 93.5% of respondents, followed by the 92.2% that tuned in via a live TV channel. Recorded TV was used by 25.8% of respondents.
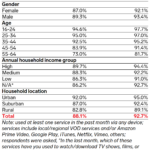
- VOD viewership saw high penetration rates across age groups, income levels, and household locations (urban, suburban, and rural). It’s a sign that subscription VOD (SVOD) services like Netflix and ad-supported VOD (AVOD) services like Hulu are easy to adopt. Older Gen Z led adoption in H1 2022, with a penetration rate of 97.7% for ages 16 to 24. Only one age cohort was below the 90% mark, ages 55 to 64, with 81.7% penetration.
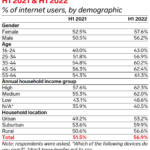
- Increased adoption of smart TVs is influencing how consumers source their content. Well over half of US internet users (56.9%) owned a smart TV in H1 2022, compared with 43.1% in H1 2019. Household income level affected smart TV ownership, with 62.3% of high-income respondents owning smart TVs but just 48.6% of low-income respondents.
Content consumption is becoming more mobile because of emerging mobile platforms that encourage high engagement.
- In H1 2022, daily time spent on mobile devices was up 39.3% from three years ago and 8.9% from H1 2021. This metric measures nonvoice smartphone usage and showed a 3:29 daily average this year.
- Because of mobile’s greater access to content, time spent with PC/tablet devices is shrinking—it stood at 3:38 in H1 2022, down 10.3% since 2019.
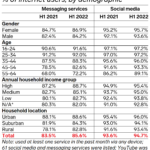
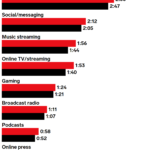
- Mobile media consumption is boosted by social networks and messaging apps, which are mainly used on smartphones. US daily time spent with social media/messaging apps was 2:12 in H1 2022. Social media penetration was 96.1% of internet respondents.
Total listenership of digital audio formats is on the rise.
- Total audio minutes showed an uptick from last year. Formats including radio, music streaming, and podcasts amounted to 4:05 in H1 2022, up 10.1% from H1 2021.
- Radio time was relatively stable at 1:11 this year, down just 5 minutes since 2019. There was a 4-minute bump in radio time year over year (YoY) in H1 2022, likely related to resumed commuting as in-person workplaces became the norm again.
- Digital audio formats are surging: Music streaming was up 27.5% from three years ago and averaged 1:56 daily in H1 2022. Podcast listening time was up 20.8% since 2020 and averaged 0:58 daily in H1 2022. The penetration rate for digital audio was 78.5% of internet users.
US device owners are showing an increasing capacity for digital products, especially those with a “smart” twist.
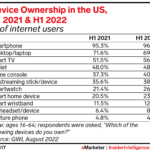
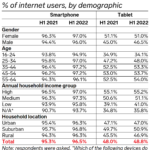
- Smartphone ownership is ubiquitous—96.5% of consumers in H1 2022. Only respondents ages 16 to 24 saw ownership rates under 95%.
- As streaming increases, it’s clear that smart TV connections to the internet are now preferred over other methods like using a streaming stick. Smart TV ownership reached 56.9% of internet users in H1 2022, up 5.4 percentage points YoY and up 13.8 points from 2019.
- Smart appliance/peripherals ownership rates showed strong growth across the board, albeit from a smaller adoption base. Smartwatch ownership rates surpassed a quarter of internet users in H1 2022, at 26.3%. That’s more than double the rate of ownership in 2019.
- Millennials and Gen X over indexed in smartwatch uptake, likely a reflection of higher income levels. In H1 2022, 35.1% of high-income respondents owned a smartwatch.
- Ownership of smart home products grew in H1 2022 to 23.9%. This was up 3.4 percentage points from H1 2021.
- Smart wristbands also showed growth, albeit as a more niche segment, as 12.3% of internet users owned them in H1 2022.
- Game console ownership seems near a ceiling, as growth has been limited over the past few years. It reached a high of 40.0% of consumers in H1 2022.
- Virtual reality (VR) headset ownership, despite a lot of fanfare in recent years, was low. Just 8.6% of respondents owned such a device in H1 2022. Younger age groups between 16 and 44 showed slightly higher rates of adoption.
- Tablets are the only form factor in decline since 2019. Almost half, 48.8%, of internet users owned tablets, compared with 51.1% three years ago. Ownership rates are shrinking more heavily for ages 16 to 24. More than a decade after the introduction of the iPad, the consumer market for these products appears to have reached a saturation point.


 Key Takeaways