Insights into global media and device usage in 44 markets, and how consumer habits shifted towards mobile after the 2020 pandemic lockdown.
 Canada
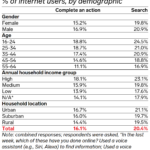
 Canada coverage in the Global Media Intelligence Report includes poll results of the following metrics. Click the links to see each country’s or territory’s charts for the following metrics:
- Device Ownership
- Smartphone and Tablet Owners
- Smart TV Owners
- Average Time Spent With Media
- Traditional Media Users
- TV Viewers
- Video-on-Demand (VOD) Viewers
- Social Media/Messaging Users
- Digital Audio Listeners
- Voice Assistant/Search Users
 Key Takeaways
- Mobile media consumption in Canada trails many other similar countries tracked by GWI. While the smartphone market is nearly fully saturated, average daily time spent on mobile devices is relatively low—over half an hour less than in the US.
- Online streaming is gaining on broadcast TV viewership, both in terms of the penetration rate of internet users and daily time spent with each medium. An increase in the number of available VOD services is fueling this shift, as is heavier adoption of digital devices that make it easy to stream, like smart TVs.
- Audio listenership is expanding, as more listeners tune in to a variety of formats. Traditional radio remains fairly fixed, but digital formats like music streaming, audiobooks, and podcasts are significantly growing the total listening audience in Canada.
- Social media usage continues to rise, driven by new platforms that attract younger audiences. Most users report they use several social networks to meet a variety of entertainment and communication needs.
Canada in Perspective
The move to mobile media is slower in Canada compared with similar digitally inclined markets.
- Mobile time spent averaged 2 hours and 58 minutes (2:58) daily in H1 2022, well below the 3:29 figure for the US. This daily rate of mobile consumption ties Canada for 29th out of the 45 countries tracked by GWI, which include many markets with less developed digital and mobile infrastructure.
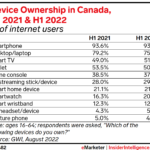
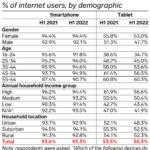
- Smartphone reach dropped to 93.3% in H1 2022, down slightly from a year ago. The US rate was 96.5%. Feature phone reach in Canada also dropped marginally to 4.2% of internet users.
- Smartphone penetration dropped the most (3.8 percentage points) for older Gen Z, ages 16 to 24. This could be related to price inflation for younger consumers, who have lower disposable income.
- PC/tablet time spent is slower to decline in Canada as a consequence of lower mobile consumption. Time spent with this format was 3:48 daily in Canada, down 17 minutes from H1 2021. However, compared with 2019, daily time spent was up 6.5%. In the US, PC/tablet time dropped 10.3% over this period.
The cost of mobile data in Canada is expensive and hinders adoption rates of services that are mainly mobile, like streaming and social media.
- Streaming video consumption is considerably lower in Canada than in the US. This is also influenced by a wider array of service choices south of the border. Daily time spent with online TV/streaming in H1 2022 averaged 1:33 in Canada versus 1:53 in the US.
- Overall, Canada ranks 12th in online TV/streaming among all the countries tracked by GWI. The penetration rate of streaming services in H1 2022 was 91.0% in Canada versus 93.5% in the US.
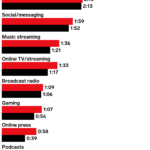
- Canada’s social media/messaging consumption, which is heavily mobile, also trails similar digital economies. Average daily time spent on social networks was 1:59 in Canada versus 2:12 in the US. Canada ranked 28th among the countries tracked by GWI for time spent with social media/messaging.
Online TV/streaming viewership is gaining fast on broadcast TV.
- Digital video is eating into TV time. Time spent with online TV/streaming—1:33 daily—was about two-thirds (68.9%) of broadcast TV—2:15 daily—in H1 2022. That’s up from 57.9% last year and 47.6% in 2019.
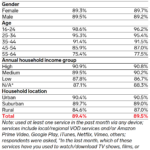
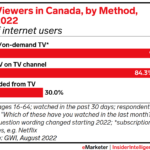
- TV’s numbers are still strong. In H1 2022, 84.3% of respondents watched live TV or a traditional TV channel. Males were more likely to report TV watching (86.7%) than females (81.9%). The rate of TV viewership can’t be compared to any previous year’s GWI data because the wording of the question changed.
- But video penetration now outpaces TV. More consumers (91.0%) watched an on-demand/streaming service than broadcast TV. The oldest age cohort (55 to 64) under indexed in this form of content consumption, at 79.1%.
- Smart TV and streaming stick/device ownership rates are propping up online TV/streaming viewing:
- More than half of respondents (51.5%) owned a smart TV in H2 2022, up from 49.0% last year and 39.3% in H1 2019.
- And 29.9% of internet users owned a streaming stick in H1 2022, up from 28.0% last year and 22.2% in 2019.
Audio listenership is overall on the rise, propelled by digital formats.
- Daily time spent with broadcast radio, music streaming (including audiobooks), and podcasts grew almost 18% between H1 2021 and H1 2022.
- Broadcast radio gained 3 minutes year over year (YoY) to reach 1:09 in H1 2022 for average daily time spent, a reflection of resumed commuting. Listening time is still down from 1:16 in 2019, perhaps a sign that remote work has increased.
- Music streaming gained 15 minutes YoY to reach 1:36 in H1 2022, as services like Spotify and audiobooks gain traction.
- Podcasts gained 15 minutes YoY to reach 52 minutes in H1 2022, as demand for this digital form of talk radio increases.
- Broadcast radio penetration still outpaces digital formats.
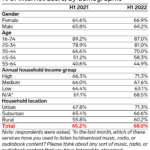
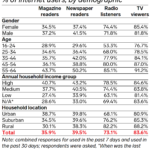
- But it’s waning, down 2 full percentage points YoY to 73.1% of respondents in H1 2022. Notably, urban listeners showed the biggest drop YoY, from 73.4% to 68.1%.
- Music streaming was reported by 68.0% of consumers in H1 2022. Younger age brackets were more likely to listen this way, led by ages 16 to 24, of whom 87.0% were music streamers.
Social media consumption and penetration are growing, and most users participate in a wide array of platforms.
- Social media/messaging time spent grew by 7 minutes from H1 2021 to H1 2022, reaching 1:59.
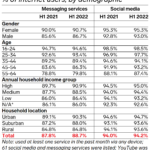
- Social network penetration was 94.2% in H1 2022, determined by respondent usage of any of 41 named social networks.
- Only a small minority of users (13.3%) focused their social media/messaging usage on one or two platforms. Older users (ages 55 to 64) were more likely to fall into this category, as well as lower-income and rural users.
- Almost two-thirds (65.0%) of internet users reported using between three and eight social networks/messaging services.
- Nearly 1 in 5 (18.2%) of respondents used nine or more social/messaging sites, including the 8.4% that used 11 or more. Those in the youngest age category were the most likely to be wide platform users: 15.7% of ages 16 to 24.


 Key Takeaways