Insights into global media and device usage in 44 markets, and how consumer habits shifted towards mobile after the 2020 pandemic lockdown.
 Asia Pacific
 The Asia-Pacific coverage in the Global Media Intelligence Report includes poll results from Australia, China, Hong Kong, India, Japan, South Korea, and Taiwan. Click the links to see each country’s or territory’s charts for the following metrics:
- Device Ownership
- Smartphone and Tablet Owners
- Smart TV Owners
- Average Time Spent With Media
- Traditional Media Users
- TV Viewers
- Video-on-Demand (VOD) Viewers
- Social Media/Messaging Users
- Digital Audio Listeners
- Voice Assistant/Search Users
 Key Takeaways
- The countries of Asia-Pacific are diverse—with hundreds of local languages and rural-urban divides—but the region’s common digital traits are apparent, especially as they relate to the adoption of new technologies.
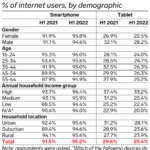
- The usage of voice assistants—on smartphones mainly, but also via smart home products—is highest in this region. Inputting text is difficult for certain languages here (particularly in China and India), providing an excellent use case for voice assistants.
- Social media and messaging service adoption is ubiquitous, like in most other regions, but what’s unique to Asia-Pacific is the number of apps consumers use. It is more common to use seven or more apps, a reflection of how ingrained these apps are for communication and commerce.
- TV viewership in the region is the lowest worldwide. This lagging position also applies to VOD content streamed over the internet. Expect this trend to persist in the region, as the number of internet users increases and online mediums predominate.
Asia Pacific in Perspective
 Leading Ahead
When it comes to media habits, Asia-Pacific often leads or trails all other regions in key digital categories. It is leading in these categories:
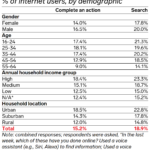
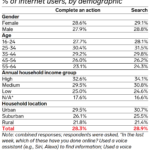
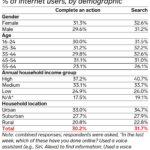
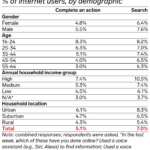
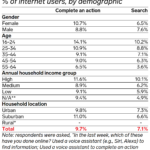
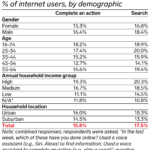
- Asia-Pacific is the top region for usage of voice assistants: 40.7% of internet users said they used this tech in H1 2022. That’s well ahead of No. 2 North America, at 33.4%. Using voice assistants to complete an action (cited by 25.7% of respondents) was almost as common as using them to find information (26.6%). In China, it’s tedious to manually input each character on a phone, so voice is simply a faster way to enter text. In India, there is an array of different languages, and voice assistants make inputting messages simpler. Across the region, consumers are more open-minded about new technologies in general and less concerned about data privacy than are consumers in the West.
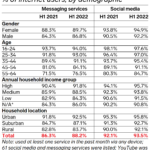
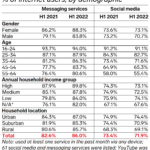
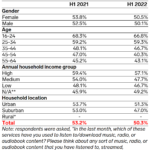
- Fragmented usage of social media and messaging apps is most evident here: Almost one-fifth (19.2%) of respondents used 11 or more services for social media and messaging. That’s much higher than other regions, especially Western Europe (5.8%) and North America (10.8%). This is again driven by China and India. It’s a reflection of social media being at the heart of many daily tasks, such as using live video for social commerce and for connecting with loved ones.
 Trailing Behind
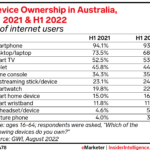
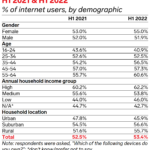
- PC ownership in the region was 53.6% in H1 2022, almost 5 percentage points lower than in Southeast Asia (58.3%). Ownership in leading regions like Western Europe and Central and Eastern Europe was equal to about three-quarters of internet users.
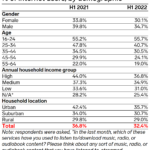
- Game console ownership in Asia-Pacific, at 14.2% in H1 2022, trails that of most other regions significantly. For comparison, ownership of these devices was over the 30% mark in North America, Western Europe, and Latin America. Low-income respondents were less than half as likely to own a game console than those with high incomes.
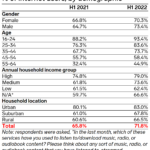
- Traditional TV viewership here lags that of every other region worldwide. Less than two-thirds (66.5%) of respondents said in Q1 2022 that they had recently watched linear TV. Every other region had 80% penetration or higher. The preference for internet-based, shorter-form content on mobile devices reduces traditional TV consumption in the region.
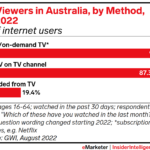
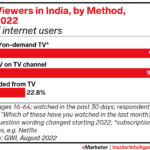
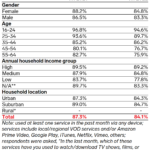
- Penetration rates for streaming, live, and recorded TV in Asia-Pacific are well behind those of other regions. In H1 2022, penetration of subscription VOD (SVOD) and on-demand TV in Asia-Pacific was 87.7% in H1 2022; most other regions saw rates over 90%. Live TV penetration was 82.5%, ranking Asia-Pacific well behind all other regions. And recorded TV viewership amounted to 21.4% of respondents, once again ranking the region at the bottom of all those tracked by GWI.
- Radio listenership is also the lowest here. Less than half (45.4%) of respondents listened to the radio in Q1 2022. By comparison, North America and Western Europe had much higher listenership, at 76.9% and 77.2%, respectively.
Media Consumption by Country
 Australia
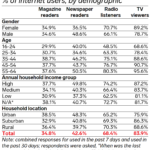
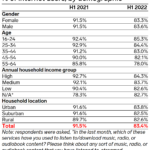
- Audio streaming is significantly less common in Australia than in the greater Asia-Pacific region. In H1 2022, 71.8% of internet users streamed audio, several percentage points less than the regional average of 78.2%. This is likely due to an Australian attachment to traditional radio, which 68.4% of respondents said they listened to in Q1 2022, compared with 45.4% in the total region.
 China
China
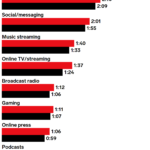
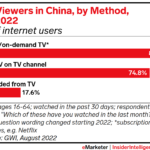
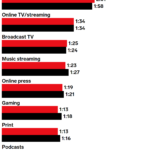
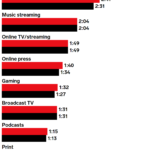
- Streaming VOD exceeds live TV in time spent and penetration. Nearly three-quarters (74.8%) of internet users in China watched live TV in H1 2022, with the 45-to-54 age group being the most likely to do so, and the 16-to-24 age group the least likely. Penetration of SVOD and on-demand TV (83.7%) is higher than that of live TV. Respondents spent an average of 1 hour, 34 minutes (1:34) daily with online TV or streaming video in H1 2022 versus 1:25 per day on broadcast TV.
- China’s game console ban was lifted in 2015, but its penetration rate of 13.2% this year still trailed that of more advanced markets like the US, Canada, Japan, and Western Europe. Further suppressing ownership of these devices is the fact that regulators have launched a campaign to rein in gaming among minors. Daily gaming time was 1:13 in H1 2022, down 5 minutes year over year (YoY) and 10 minutes less than two years ago.
 India
India
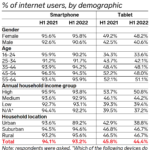
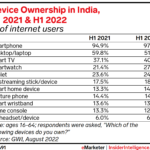
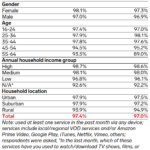
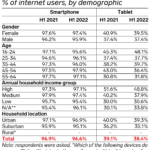
- The mobile on-ramp to the internet is instrumental in India, as slightly less than half of the country’s population is online. Some 97.2% of internet users were smartphone owners in H1 2022, though 14.1% still had feature phones. PC ownership is in rapid decline; only about half (51.7%) of internet users owned this device, compared with over 70% in H1 2019.
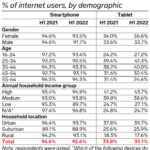
- Tablet ownership (24.7%) is on the lower end compared with some of India’s more advanced Asia-Pacific neighbors, and on par with Japan. Just 17.6% of respondents with low incomes owned a tablet.
 Japan
Japan
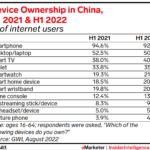
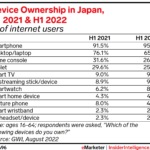
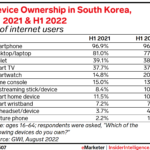
- The country’s aging society is reflected in its slower uptake of smart devices. Japan lags in wearable device penetration; smartwatch and smart wristband ownership rates have remained very low, at 8.8% and 2.5%, respectively. That’s well below the Asia-Pacific average of 22.4% for smartwatches and 16.3% for wristbands. Compared with its Asia-Pacific neighbors, Japan has extremely low smart TV ownership (9.4%); the regional average was 38.5%.
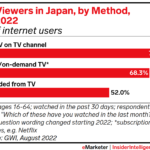
- The older population may also help explain why live TV remains more popular than SVOD in Japan. With a penetration rate of 68.3%, SVOD/on-demand TV continues to trail live TV (76.6%). In the Asia-Pacific region, it outpaces live TV in viewership.
 South Korea
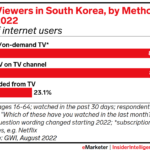
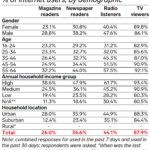
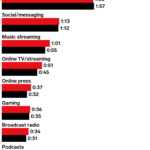
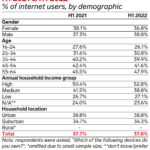
- South Korea’s presidential election in March 2022 appears to have had a positive impact on its traditional media consumption. Both radio and print media received a slight bump in time spent over the past year. Daily radio time increased by 3 minutes to reach 34 minutes in H1 2022. Likewise, print media gained 4 minutes to reach 28 minutes per day. It’s worth noting that online press also gained 5 minutes (reaching 37 minutes), as the demand for news during election season increased consumption.
 Hong Kong
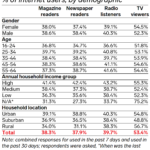
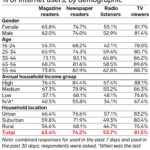
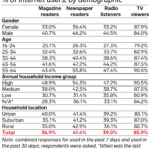
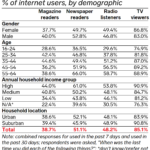
- A strict national security law, which took effect in June 2020, may have accelerated the decline of print media, including magazines and newspapers. The law enacts strong penalties for publishers that are critical of public policy, casting a chill on journalistic freedom and eroding trust in print media’s role in holding the government accountable. Newspaper readership dropped significantly YoY in Q1 2022—51.1% of respondents said they read a newspaper recently, down from 57.0% in Q1 2021. Magazine drop-off is evident as well, down to 38.7% from 45.8% last year.


 Key Takeaways